
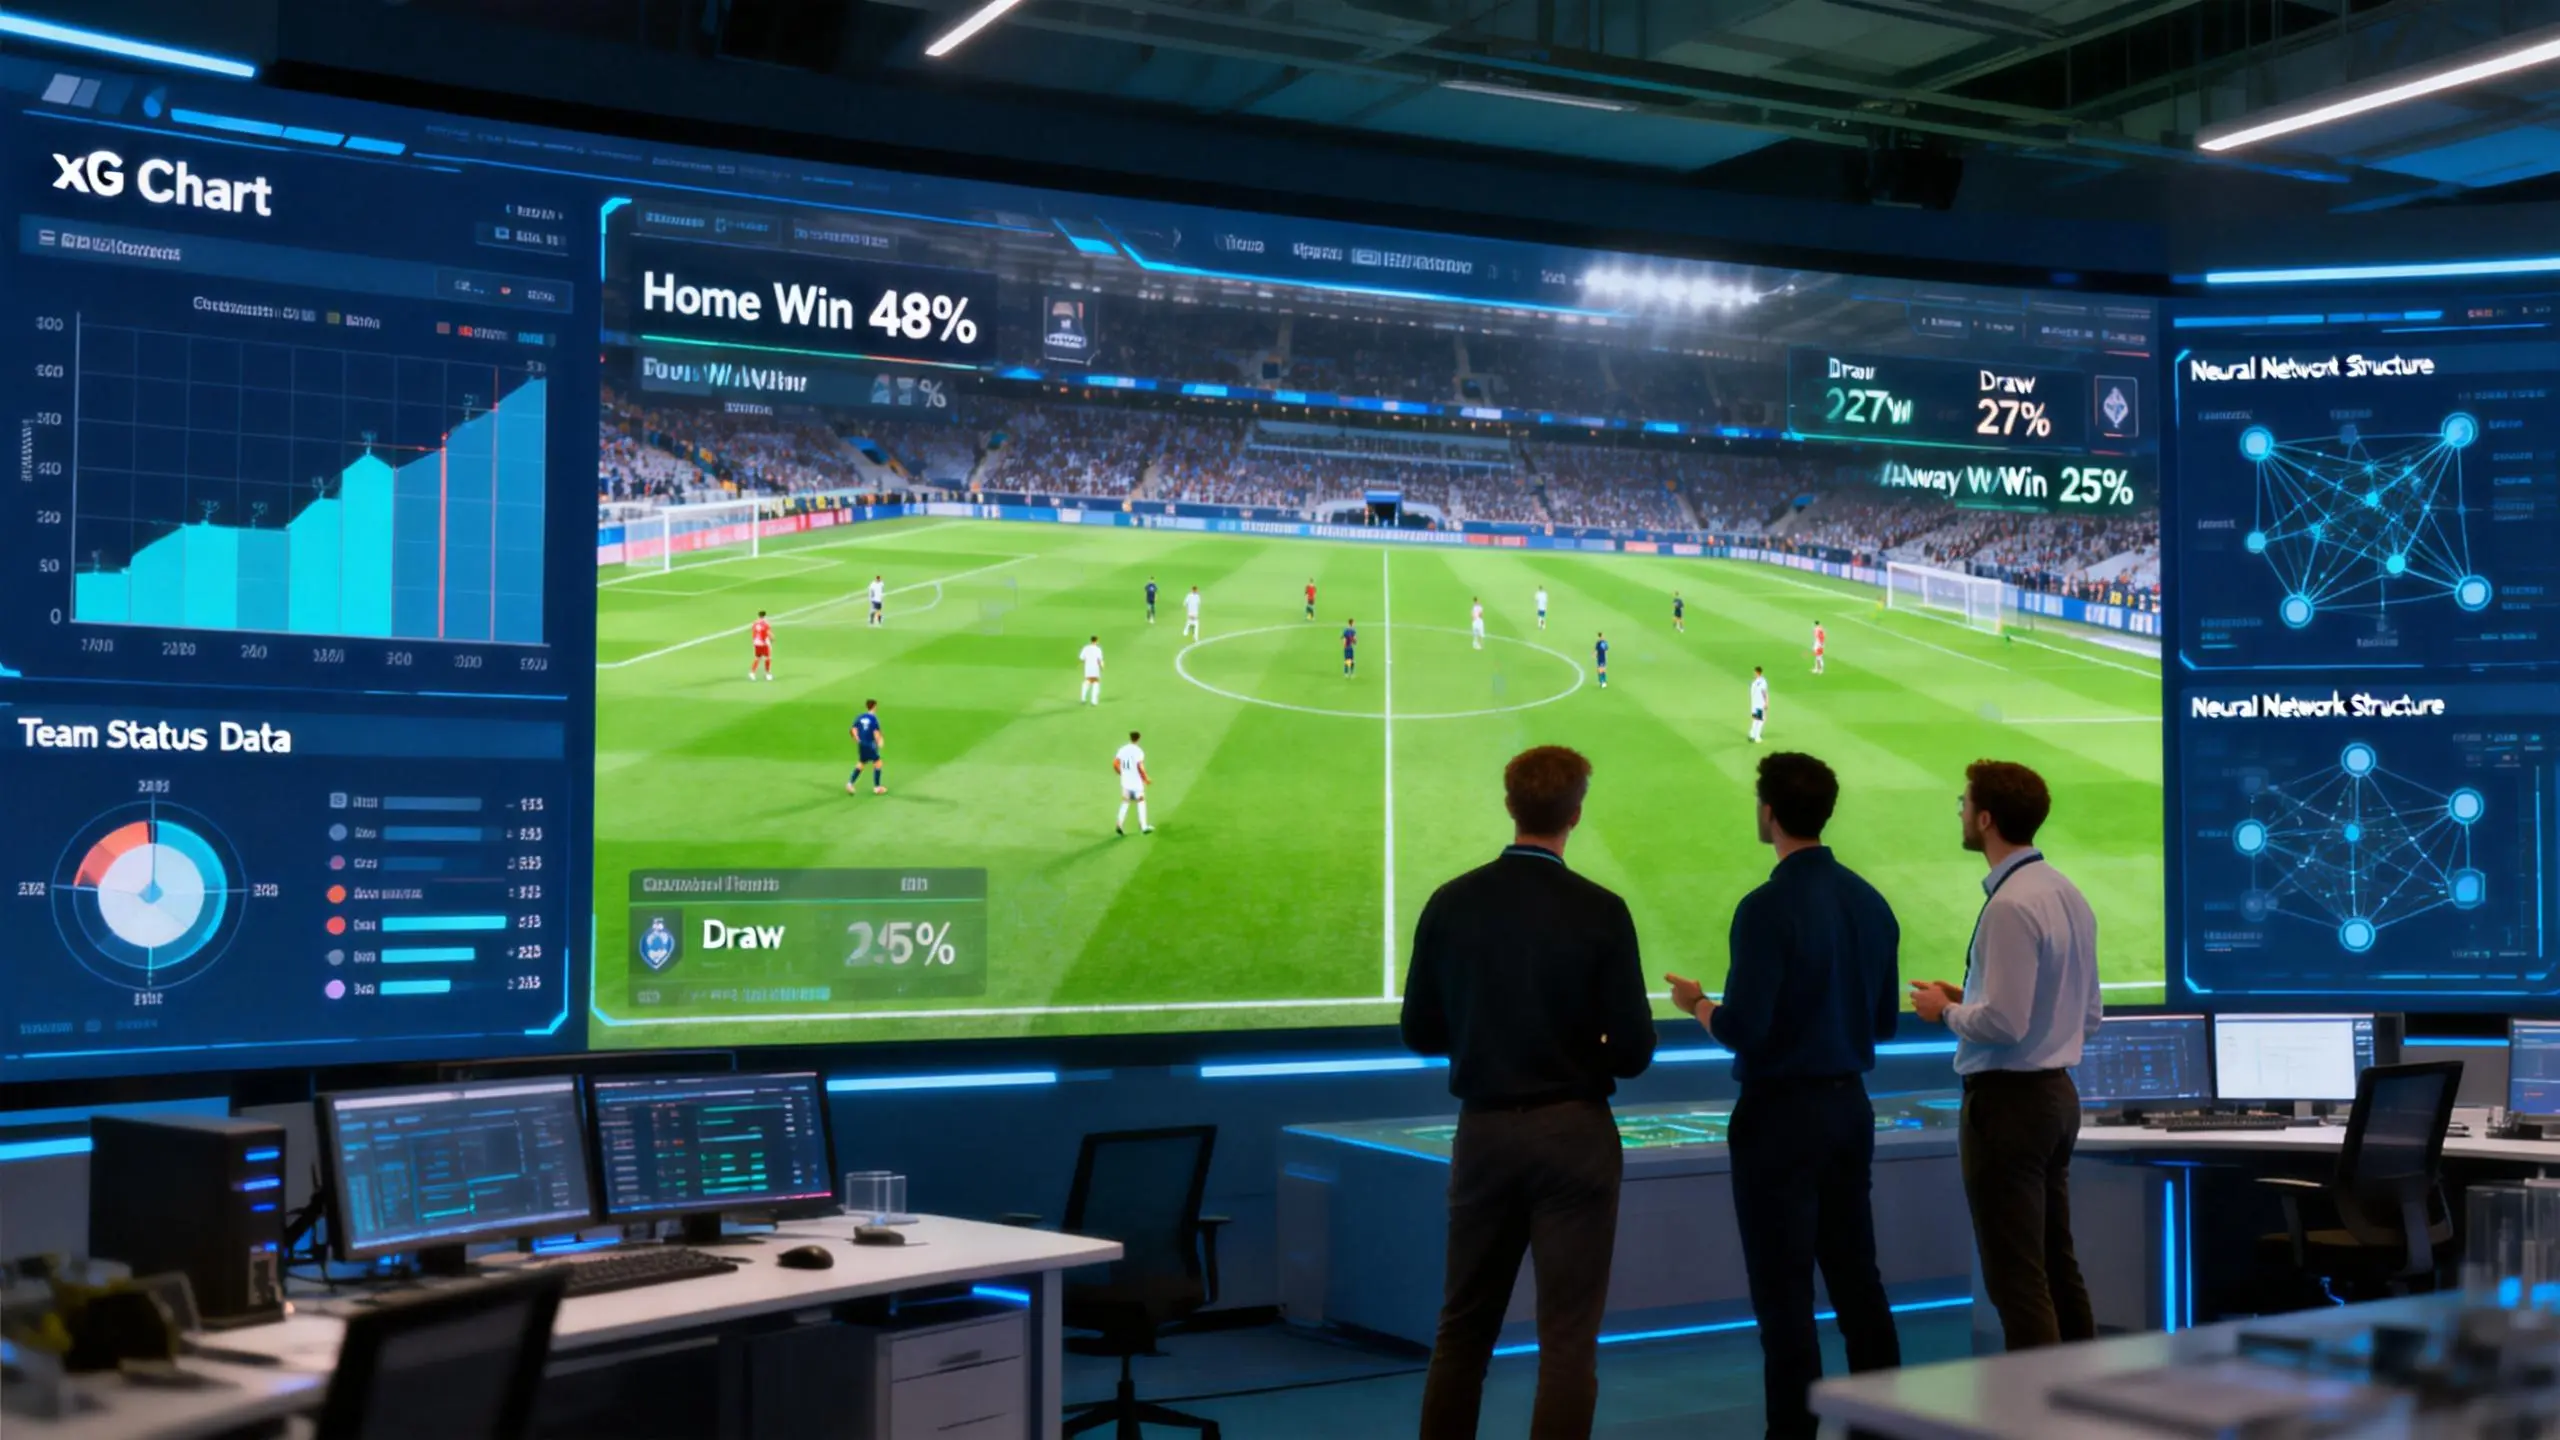
AI Football Predictions: How They Work, Which Models Win, and What the Data Actually Shows
Every weekend, millions of football fans try to predict match outcomes. Most rely on gut feeling, loyalty to their team, or the opinion of a pundit who got lucky last week. AI does something different. It reads data — thousands of data points per match — and finds patterns that human intuition misses.
This guide explains how AI football predictions actually work, compares the major prediction models used today, and shows you real, verified results from one platform that publishes every win and every loss.
No hype. No guaranteed wins. Just how the math works, and what it can (and cannot) do.
What Are AI Football Predictions?
AI football predictions use machine learning and statistical models to estimate the probability of match outcomes — win, draw, loss, total goals, handicap lines — by analyzing historical data, current form, and real-time odds movements.
The key difference from human tipsters is not that AI is "smarter." It is that AI is consistent. It does not have a favorite team. It does not panic after a losing streak. It processes the same variables the same way every single time.
AI vs Human Tipsters: The Real Differences
| Factor | AI Prediction | Human Tipster |
|---|
| Data Processing | 10+ bookmaker odds every 10-20 seconds | Watches matches, reads news |
|---|---|---|
| Consistency | Same model, same rules, every match | Varies by mood, confidence, bias |
| Emotional Bias | Zero — no favorite teams | Often biased toward popular clubs |
| Speed | Analyzes 50+ matches simultaneously | 3-5 matches per day maximum |
| Coverage | 19+ leagues, every match | Usually 2-4 leagues |
| Transparency | Model logic can be audited | "Trust me, I've been doing this for years" |
| Losing Streaks | Continues same process | Often changes strategy mid-run |
But most people are not that expert. And AI does not need to be perfect. It needs to be slightly better than the odds suggest — consistently, across thousands of bets.
How AI Models Predict Football
There is no single "AI football prediction model." Different platforms use different approaches. Here are the five most common, with honest assessments of each.
1. Dixon-Coles Model (What OddsFlow Uses)
The Dixon-Coles model, published by Mark Dixon and Stuart Coles in 1997, is the gold standard for football match prediction in academic statistics.
How it works:
The model estimates two key parameters for every team: an attack strength (how many goals they tend to score) and a defense strength (how many goals they tend to concede). It also includes a home advantage factor and a special correction for low-scoring matches (0-0, 1-0, 0-1, 1-1) where the standard Poisson distribution underperforms.
For a match between Team A (home) and Team B (away), the model calculates:
- Team A expected goals = Team A attack x Team B defense x home advantage x league average
- Team B expected goals = Team B attack x Team A defense x league average
These expected goals are then fed into a Poisson distribution to generate probabilities for every possible scoreline (0-0, 1-0, 2-1, etc.), which are summed to produce match outcome probabilities.
Strengths: Proven academic foundation. Transparent and auditable. Handles low-scoring corrections well. Excellent for Asian Handicap and Over/Under markets where precise goal expectation matters.
Weaknesses: Requires careful time-decay weighting (recent matches matter more). Does not inherently account for player-level data. Needs supplementary models for factors like red cards, weather, and altitude.
2. ELO Rating Systems
Originally designed for chess by Arpad Elo, ELO ratings assign each team a numerical strength rating that updates after every match. Win against a strong opponent? Your rating goes up a lot. Lose to a weak team? It drops sharply.
Strengths: Simple, intuitive, computationally cheap. Good for ranking teams over long periods.
Weaknesses: Does not predict scorelines — only win probabilities. Cannot generate Asian Handicap or Over/Under predictions. Treats a 1-0 win the same as a 5-0 win. Slow to react to mid-season changes.
3. Expected Goals (xG) Models
xG models evaluate the quality of every shot taken in a match — the position on the pitch, angle to goal, body part used, whether it was a counter-attack — and assign a probability of scoring.
Strengths: Measures underlying performance better than raw results. A team that creates 3.2 xG but scores 1 goal is probably unlucky, not bad.
Weaknesses: Requires detailed shot-level data (expensive to obtain). Retrospective — it tells you what *should have* happened, not what will happen. Less useful as a standalone prediction model without additional layers.
4. Neural Networks / Deep Learning
Neural networks process raw historical data through multiple layers of artificial neurons, finding complex non-linear patterns that simpler models miss.
Strengths: Can discover unexpected patterns. Handles massive datasets. Theoretically the highest ceiling for accuracy.
Weaknesses: Black box — you cannot explain *why* it made a prediction. Prone to overfitting (performing well on historical data but poorly on new data). Requires enormous training datasets. Expensive to run.
5. Ensemble Methods
Ensemble methods combine multiple models — e.g., Dixon-Coles + ELO + xG — and weight their predictions to produce a final output.
Strengths: Reduces the weakness of any single model. More robust across different match types.
Weaknesses: Complex to build and maintain. Risk of "model soup" where no one understands the final output. Only as good as the underlying models.
Model Comparison Matrix
| Criterion | Dixon-Coles | ELO | xG | Neural Net | Ensemble |
|---|
| Accuracy | High | Medium | Medium-High | Variable | High |
|---|---|---|---|---|---|
| Explainability | High | High | Medium | Low | Low |
| Data Requirements | Medium | Low | High | Very High | High |
| Scoreline Prediction | Yes | No | Partial | Yes | Yes |
| AH/OU Markets | Excellent | Poor | Good | Good | Good |
| Speed | Fast | Very Fast | Medium | Slow | Medium |
| Overfitting Risk | Low | Very Low | Medium | High | Medium |
| Academic Validation | Extensive | Extensive | Growing | Limited | Limited |
The OddsFlow Approach: Dixon-Coles + Monte Carlo
OddsFlow does not just run a basic Dixon-Coles model. The system combines Dixon-Coles with several additional layers:
Step 1: Odds Collection
Every 10-20 seconds, OddsFlow scans odds from 10+ major bookmakers: Bet365, Pinnacle, Betfair, William Hill, 1xBet, Unibet, Bwin, Betway, 888Sport, and others. This is not about finding the "best odds" — it is about reading the market consensus. When 10 bookmakers all price a team at roughly the same level, that is a strong signal about the true probability.
Step 2: De-Vigging with Shin Method
Bookmaker odds include a margin (the "vig" or "juice"). A fair coin flip should be priced at 2.00/2.00, but bookmakers might price it at 1.91/1.91, keeping ~4.7% for themselves.
OddsFlow uses the Shin Method to strip this margin out. Unlike simpler methods (multiplicative or additive), Shin's approach accounts for the fact that bookmakers adjust odds asymmetrically — they shade the price more on outcomes where they have less information. This produces more accurate "true" probabilities.
Step 3: Dixon-Coles Parameters
Using the de-vigged probabilities and historical match data, OddsFlow calculates attack and defense lambda parameters for every team. These parameters include:
- Time decay — recent matches weighted more heavily
- Home/away split — separate parameters for home and away performance
- League coefficients — adjustments for league strength differences
League Coefficient Table
| League | Coefficient | Reasoning |
|---|
| Premier League | 1.00 | Benchmark league |
| La Liga | 0.85 | Elite quality, less physical |
| Bundesliga | 0.85 | High-tempo, open matches |
| Serie A | 0.80 | Tactically disciplined |
| Ligue 1 | 0.75 | Top-heavy league structure |
| Champions League | 1.05 | Best vs best, elevated performance |
| Europa League | 0.80 | Mixed quality |
| Eredivisie | 0.70 | High-scoring but lower defense quality |
| Liga Portugal | 0.70 | Strong top 3, weaker rest |
| Turkish Super Lig | 0.65 | Passionate but inconsistent |
| Saudi Pro League | 0.60 | Star players, variable squad depth |
| J-League | 0.60 | Technical, well-organized |
| K-League | 0.55 | Competitive, limited depth |
| Liga 1 Indonesia | 0.50 | Developing league |
| Brazilian Serie A | 0.75 | Physical, technically skilled |
| Argentine Primera | 0.70 | Intense, tactical |
| MLS | 0.60 | Growing quality, parity-focused |
| Scottish Premiership | 0.60 | Celtic/Rangers dominated |
| Belgian Pro League | 0.65 | Talent development league |
Step 4: Monte Carlo Simulation
Once attack/defense parameters are calculated, OddsFlow runs 10,000 Monte Carlo simulations for every match. Each simulation generates a random scoreline based on the Poisson-distributed goal expectations, then checks the result against various betting markets.
After 10,000 runs:
- If Team A wins 5,847 simulations, draws 2,103, and Team B wins 2,050 — the model assigns probabilities of 58.5% / 21.0% / 20.5%
- These probabilities are compared to bookmaker odds to identify value bets — where the model thinks the true probability is higher than what the odds imply
Step 5: Signal Generation
A bet is flagged as a "signal" only when:
- The model probability exceeds the implied probability by a minimum threshold (the "edge")
- The edge is confirmed across multiple bookmakers (not just one outlier)
- The match passes various sanity checks (no obvious data errors, sufficient historical data)
Verified Results: +$638,342 from 9,585 Bets
This is where most prediction platforms go quiet. They show you a few winning screenshots, a cherry-picked month, a "92% accuracy" claim with no audit trail.
OddsFlow publishes everything. Every bet. Every win. Every loss. Every day.
Overall Performance
| Metric | Value |
|---|
| Total Profit | +$638,342 |
|---|---|
| Total Bets | 9,585 |
| Win Rate | 57.0% |
| ROI | +17.74% |
| Leagues Covered | 19+ |
| Tracking Period | 2025-present |
Profit by Market
| Market | Profit | Share |
|---|
| Asian Handicap (AH) | +$447,256 | 70% |
|---|---|---|
| Over/Under (O/U) | +$106,569 | 17% |
| 1X2 Moneyline | +$84,826 | 13% |
The World Cup 2026 Reality Check
During Week 1 of the World Cup 2026, OddsFlow lost $89,814 with a 36% win rate. Group stage matches involving unfamiliar national team matchups exposed gaps in the model's historical data.
What happened next:
- 1The team recalibrated league coefficients for international football
- 2Added tournament-specific factors (altitude, travel fatigue, group-stage vs knockout dynamics)
- 3Within 5 days, the model recovered: +$159,195 with a 64% win rate
We published this entire journey in our transparency report. No hiding. No excuses. This is what responsible AI prediction looks like.
You can verify every claim at /performance/verification-proof.
19+ Leagues Covered
OddsFlow generates predictions for every match in every league listed below. This is not "we sometimes cover these leagues." Every match, every day, full coverage.
| League | Country | Seasons Tracked |
|---|
| Premier League | England | 5+ |
| La Liga | Spain | 5+ |
| Bundesliga | Germany | 5+ |
| Serie A | Italy | 5+ |
| Ligue 1 | France | 5+ |
| Champions League | Europe | 5+ |
| Europa League | Europe | 5+ |
| Eredivisie | Netherlands | 3+ |
| Liga Portugal | Portugal | 3+ |
| Turkish Super Lig | Turkey | 3+ |
| Saudi Pro League | Saudi Arabia | 2+ |
| J-League | Japan | 3+ |
| K-League | South Korea | 3+ |
| Liga 1 | Indonesia | 2+ |
| Brazilian Serie A | Brazil | 3+ |
| Argentine Primera | Argentina | 3+ |
| MLS | USA/Canada | 3+ |
| Scottish Premiership | Scotland | 3+ |
| Belgian Pro League | Belgium | 3+ |
| FIFA World Cup 2026 | International | Special model |
Pre-Match vs Live Signals: Two Different Products
OddsFlow operates two distinct prediction systems, and understanding the difference matters.
Pre-Match Predictions
Generated hours before kickoff using the full Dixon-Coles model. These analyze the overall match — team strengths, historical matchups, odds consensus. Think of pre-match predictions as a research analyst's report: thorough, data-rich, useful for planning.
Pre-match predictions cover 1X2, Asian Handicap, and Over/Under markets.
Live Signals
Generated during matches by scanning real-time odds movements every 10-20 seconds. When the model detects a significant discrepancy between live odds and what the match situation suggests, it fires a live signal.
Live signals are more like a trader's alert system. They react to in-game events — a red card that has not been fully priced in, a momentum shift the market is slow to recognize, a goal that changes the handicap dynamics.
During the World Cup 2026, live signals have outperformed pre-match predictions. Why? Because international tournament matches have more variance — upsets, unfamiliar matchups, emotional swings — and live signals can adapt in real time.
Read more: Pre-Match vs Live Signals Explained | How to Profit from Live Signals
Free vs Premium: What You Get
| Feature | Free | Premium |
|---|
| Pre-match predictions | Basic (top leagues) | Full (all 19+ leagues) |
|---|---|---|
| Live signals | 2-minute delay | Real-time, zero delay |
| Leagues | Top 5 European | All 19+ leagues |
| Historical data | Last 30 days | Full archive |
| Match detail | Summary view | Full breakdown with AH/OU lines |
| Performance tracking | Overall stats | Per-league, per-market drill-down |
| Telegram alerts | Daily summary | Every signal, instant |

Start Free | See Predictions | Live Signal Room
Frequently Asked Questions
Are AI football predictions accurate?
No prediction system — AI or human — is "accurate" in the sense of always being right. Football is inherently unpredictable. What good AI models achieve is a slight edge over the odds, consistently. OddsFlow's 57.0% win rate on Asian Handicap bets translates to +17.74% ROI over 9,585 bets. That edge is real, but it is not magic.
Can AI predict exact scores?
AI models like Dixon-Coles generate probability distributions for every possible scoreline (0-0 through 9-9). The most likely score is often 1-1 or 1-0, because those scorelines are genuinely most common. But the "most likely" score might only have a 12-15% probability — meaning it will be wrong ~85% of the time. AI is better at predicting ranges (Over 2.5 goals, Team A by 1+ goals) than exact scores.
Which is the best AI football prediction site?
It depends on what you value. If you want maximum transparency and verified P/L, OddsFlow publishes everything. If you want free predictions for 850+ football leagues (1,200+ across all sports) with no paywall, Forebet covers more ground. We compare the top platforms in detail in Best AI Football Prediction Sites 2026.
Is OddsFlow free?
Yes, there is a free tier with basic predictions and delayed live signals. Premium unlocks real-time signals, full league coverage, and detailed match breakdowns. See /get-started for details.
How does OddsFlow make money if it can predict football?
A common and fair question. OddsFlow is a prediction platform, not a betting fund. The business model is subscription revenue from users who find value in the predictions. The model's edge is real but small (4-8% per bet) — scaling that requires thousands of bets, which individual users can do across their own accounts. OddsFlow provides the signals; users decide how to use them.
What data does OddsFlow use?
Real-time odds from 10+ bookmakers (updated every 10-20 seconds), historical match results (5+ seasons per league), team-level statistics, and tournament-specific factors (altitude, travel, group dynamics for international competitions).
Further Reading
- How OddsFlow Built the World Cup Model: 12-Factor Architecture Deep Dive
- Transparency Report: We Lost $89K in Week 1 — Here Is What Happened
- Live Signal Strategy: How to Profit from Live Signals
- Platform Comparison: Best AI Football Prediction Sites 2026
- Head-to-Head: OddsFlow vs Forebet
- Pre-Match vs Live: Which Signal Type Wins?
- Live Signal Room: See Signals in Real Time
- Verified Results: Full Performance Audit
*All predictions generated by OddsFlow's Dixon-Coles model. Past performance does not guarantee future results. AI predictions are for informational and entertainment purposes. Always bet responsibly and within your means.*